In a previous blog I talked about two important sabermetric formulas.
- Bill James’s Formula is Win% = (Runs Scored)2 / [(Runs Scored)2 + (Runs Allowed)2] and
- Stan “The Stats Man” Formula is Win% = 0.000683*[(Runs Scored) – (Runs Allowed)] +.50.
James’s formula is called the Pythagorean Formula for Baseball and Stan’s Formula is called the Linear Formula for Baseball. Both formulas are used to predict a team’s season win total.
In my book “Sandlot Stats: Learning Statistics with Baseball”, the derivation of the Pythagorean Formula is presented on pages 164-170. My Linear Formula will appear in the fall, 2014 issue of the “The Baseball Research Journal.”
The 2014 Yankees had 633 runs scored and 664 runs allowed.For the Pythagorean Formula, Win% = 6332 / [6332+6642] = .4761 (win total = .4761*162 = 77.13). For the Linear Formula, Win% = .000683*(633–664) +.50 = .4788 win total = .4788*162 = 77.57).
The 2014 Mets had 629 runs scored and 618 runs allowed. For the Pythagorean Formula, Win% = 6292 / [6292+6182] = .5088 (win total = .5088*162 = 82.43).For the Linear Formula, Win% = .000683*(629–618) +.50 =.5075 (win total = .5075*162 = 82.22).
The Mets had a winning season (a team scores more runs than it allows for the entire season) and a losing record (79-83); the Yankees had a losing season (a team that allows more runs for a season than it scores) and a winning record (84-78).
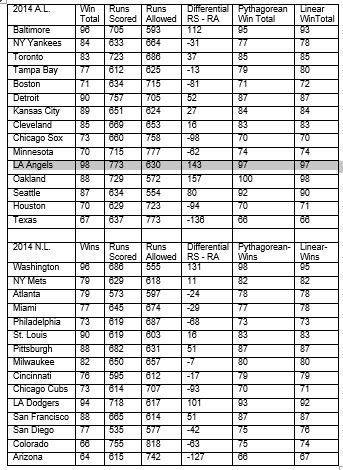
The table below shows each team’s win total, their run differential, their win total using the Pythagorean Formula, and their win total using the Linear Formula. In the National League only six teams had a positive run differential. This includes the Mets and the five teams that reached the playoffs. The Mets were the only team in all of baseball with a positive run differential and a losing record. This would indicate that the Mets had played well enough to have a winning record (the first time since 2008). In the American League only seven teams had a negative run differential and of those only the Yankees had a winning record. Observe in the tables below how close each team’s Pythagorean win total is to their linear win total and how close each team’s win total is to both their Pythagorean win total and their linear win total. The amazing thing is this relationship for team wins holds for every year in the major leagues from 1901 to 2014.
How well did the two sabermetric formulas predict the 10 teams that made the playoffs in 2014? For the N.L. the same five teams would have made the playoffs. The only change is St. Louis would be a wild-card team. For the A.L. four of the five teams would have made the playoffs. The only changes would be Seattle would replace Kansas City as a wild-card and Oakland would have won the division with the Angels being a wild-card