Bill James, the Father of Sabermetrics, introduced his ”Pythagorean Theorem of Baseball”. His theorem provides a formula to predict a team’s winning percentage (W%) using the runs scored (RS) and runs allowed (RA) by the team for a season. Sabermetrics uses mathematics (especially Statistics) to make objective baseball decisions. The Pythagorean Theorem of Baseball states: W% = (RS)2 / [(RS)2 + (RA)2]. Like most baseball statistics the more games a team plays the closer the predicted W% comes to the actual season’s winning percentage. For those of you who have my book “Sandlot Stats: Learning Statistics with Baseball” pages 164-168 discusses this theorem.
My latest research done with a junior math major Alex Everett introduces what I call the “Linear Theorem of Baseball.” The Linear Theorem states W% =.000683*(RS – RA) + .50. In a paper to be published, I show that my Linear Theorem and James’ Pythagorean Theorem are both successful predictors of a team’s season winning percentage for the years 1901 to 2013.
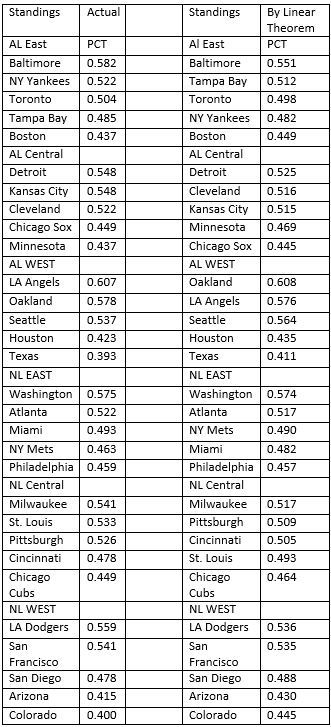
The data in the table below provides the actual standings and standings calculated by my Linear Theorem for all games played on or before August 30th, 2014.
Assuming the season ended on Aug 30, these would be the playoff results. In the AL, Baltimore wins the East by either of the two standings. Detroit and Kansas City would be tied by the actual standings and Detroit would win by the Linear Theorem standings. The LA Angels and Oakland would change places with LA winning by the actual standings. The two wild card teams by the actual standings would be Oakland and either Detroit or Kansas City (which ever lost the tie-breaker). By the Linear Theorem the two wild card teams would be the LA Angels and Seattle.
In the NL, the same three teams would be the divisional winners by both standings. In either case San Francisco would be one of the two wild card teams. St Louis would be the second wild card team by the actual standings and Atlanta would be the second wild card team by the Linear Theorem.
Of the two standings, I would choose the standings given by the Linear Theorem to predict the final playoff teams. Looking at the AL East we see that the Yankees had an actual PCT of 0.522 but dropped to a PCT of 0.482 by the Linear Theorem. What can account for this change? This tells me the Yankees have done very well in close games and part of their success can be attributed to their manager. The same argument can be given for Baltimore. The other New York team had a different result. For the Mets the actual PCT of 0.463 increased to 0.490 when applying the Linear Theorem. This reflects negatively on the Mets manager. It turns out in 1-run games the Yankees were 21-18, Baltimore was 27-19, the Mets were 21-26. Miami has the best 1-run record at 32-20 which helps to explain its better PCT by the actual standings.