One of the many contributions of Bill James to the field of sabermetrics was his Pythagorean Theorem for baseball. The theorem states that the ratio of a team’s wins to losses is equal to the square of the ratio of the team’s runs scored to the team’s runs allowed. The equation is (Wins / Losses) = (Runs Scored / Runs Allowed)2 , The exponent 2 is just an estimate. I found that for a given season this exponent ranges between 1.85 and 2.15. The idea behind the Pythagorean Theorem is that one can predict the wins and losses of a team by simply looking at the team’s runs scored and runs allowed. For those interested, the derivation of this exponent is done using simple linear regression analysis which can be found in Chapter 5 of my book, Sandlot Stats. Chapter 5 also has a complete explanation with examples of James’ Pythagorean Theorem. The name was inspired by the Pythagorean Theorem in geometry which says for any right triangle the square of the length of the side opposite the right angle is equal to the sum of the squares of the lengths of the other two sides of the triangle (c2 = a2 + b2 ).
I wish to now use James’ Pythagorean Theorem to look at the years 2001 and 2002 for the Oakland Athletics which were featured in the book Moneyball. At this point it might be worthwhile for the reader to review my last posting called Moneyball Revisited. For the year 2001, the exponent turned out to be 2.113 and for the year 2002 the exponent was 1.901. In 2001, Oakland’s actual record was 102-60. Applying the Pythagorean Theorem to their actual runs scored of 884 and runs allowed of 645, Oakland’s expected record would have been 107-55. In 2002, Oakland’s actual record was 103-59. For 2002, their actual runs scored were 800 and runs allowed were 654. Again, applying the Pythagorean Theorem, we would have expected their record to be 96-66. The loss of Jason Giambi and Johnny Damon for the 2002 season had a minor effect on their runs scored. The loss of Jason Isringhausen as their closer had no effect on their runs allowed. Using the results of the Pythagorean Theorem, Oakland would have finished second to Seattle in 2001 and fourth behind Anaheim, Boston, and New York in 2002. Again, using the results of the Pythagorean Theorem, the 2002 team would have finished 11 games behind the 2001 team.
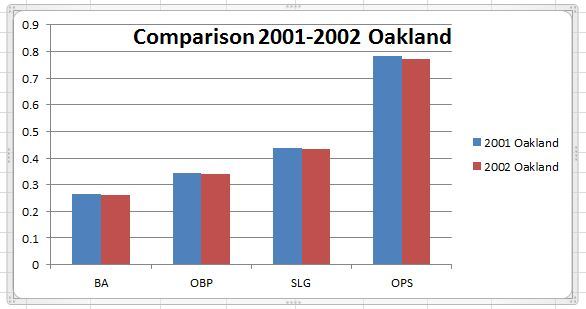
Comparing their actual won and loss records for the years 2001 and 2002, the 2002 team would have finished one game ahead of the 2001 team. The 2001 Oakland team had the second best record in the AL behind the Seattle Mariners. The 2002 Oakland team had the second best record in the AL behind the New York Yankees. The side-by-side bar graph below compares the statistics batting average (BA), on-base percentage (OBP), slugging percentage (SLG), and on-base plus slugging (OPS) for 2001 and 2002. The win-loss records and the graph below show that replacing Jason Giambi by Scott Hatteberg and replacing Johnny Damon by David Justice along with other changes allowed the 2002 Oakland team to be as successful as the 2001 team. Billy Beane accomplished this successful metamorphism without spending $33 million on Giambi. Damon, and Isrinhausen In fact, the Oakland payroll for 2002 was only $39 million. Billy Beane’s use of sabermetrics works and keeps on working today. Just look at Oakland’s record for 2012.